
Today I Learned: Geometry Can Predict a Stock Market Crash


Investors, traders, market analysts, and economists are in the business of understanding stock market movements. And a way to predict a stock market crash, or the sudden decline in the value of stocks across a significant portion of the stock market, is almost the holy grail in a never-ending search of figuring it all out.
Mathematicians at the University of the Philippines Diliman have introduced a novel approach to this challenge, offering a fresh perspective on detecting potential market crashes. This innovative method borrows concepts from topology (a.k.a. rubber-sheet geometry), which is defined by Britannica as the youngest and most sophisticated branch of geometry. It focuses on the properties of geometric objects that remain unchanged upon continuous deformation—shrinking, stretching, and folding, but not tearing, thus the name "rubber sheet."
The study, "Topological Approach for Detection of Structural Breakpoints in Philippine Stock Price Data Surrounding the COVID-19 Pandemic," by Ela Mae A. Riñon and Rachelle R. Sambayan was published in the Philippine Journal of Science in June 2024. It used the method of Topological Data Analysis to uncover patterns and geometric structures in large datasets, particularly the stock price data of three prominent Philippine companies: Cebu Air (CEB), PAL Holdings (PAL), and Century Pacific Food (CNPF), covering the period from January 2019 to January 2021. The study specifically used data during the COVID-19 pandemic since it was a time when "economic effects across different industries were obvious," according to the researchers. It also focused on companies that experienced varying degrees of impact from the pandemic.
ALSO READ
5 Things You Should Know Before Investing in the Stock Market
5 Ways to Read Price Charts and Trading Patterns to Make Money in the Stock Market
What Is Topological Data Analysis (TDA)?
Science writer Harvey Sapigao from the UP College of Science compared TDA to how we observe stars. Imagine gazing at the night sky, where stars initially appear as random points scattered across the vastness. With focused observation, patterns emerge, and constellations take shape. TDA functions similarly, transforming ambiguous data points into meaningful insights.
The Process of Topological Data Analysis
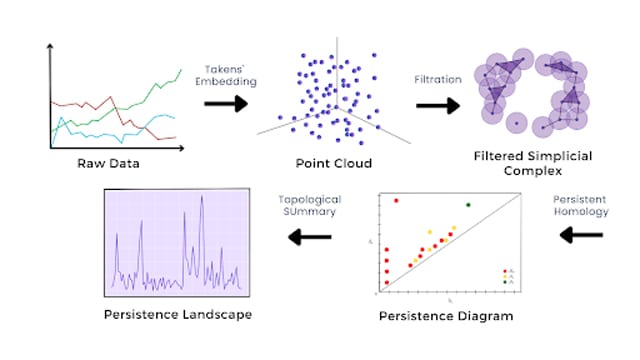
The researchers employed TDA to identify changes in the topological structure of stock market data during periods of instability. They said that the tool was used for three primary reasons: "Its approaches are unbiased, it is grounded in a robust theoretical framework, and it demonstrates greater resistance to random noise."
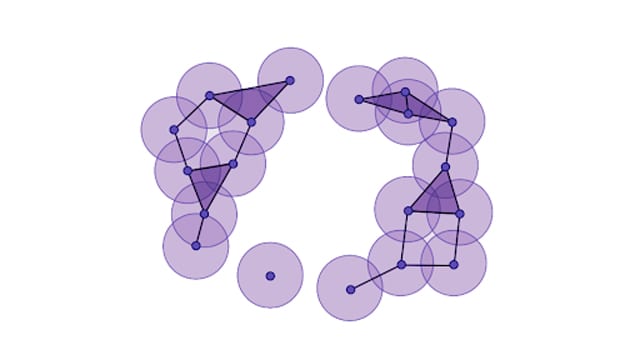
Riñon and Sambayan discovered that as stock prices began to plummet, data points clustered together, leading to changes in homology groups. These groups, which can be thought of as connected components, loops, and cavities, provide a framework for understanding the underlying data structure.
One of the key findings of their study was that the persistence of these homology groups weakens as the market approaches a crash. This weakening of persistence is significant because it signals a distinct shift in the data's topological structure, contrasting with the scattered point clouds observed during stable periods.
"This weakening of persistence is unexpected because it reveals a distinct change in the data's topological structure during market downturns, which contrasts with the scattered point clouds observed during stable periods," the authors explained.
As the balls expand, the points connect, forming different homology groups.
The researchers utilized a persistence landscape to map out the crash probability of a stock. This tool proved particularly insightful for CEB, where the persistence landscape spiked, indicating a high crash probability between 40 and 60 percent during a period of market instability in 2019. Similarly, in early 2020, the landscape showed a high crash probability prior to another CEB crash, which was linked to the pandemic's travel bans and lockdowns.
Interestingly, while CEB experienced significant fluctuations, both PAL and CNPF remained relatively stable during the onset of the COVID-19 pandemic. Although they encountered minor dips, they did not suffer a major crash, a fact that the TDA model accurately predicted. This robustness to noise—ordinary fluctuations in stock prices—demonstrates TDA's potential for offering a deeper understanding of high-dimensional data.
These findings are also consistent with an earlier study (2021) that used TDA to analyze the stock markets in Singapore and Taiwan. It said that clustering of data points within a point cloud serves as an indicator for predicting upcoming market downturns. Correlation among stocks becomes intense before the market crashes, which leads to stronger persistence weakening during a major market crash.
Conclusion and Recommendation About the Use of Geometry in Predicting Stock Market Crash
"Our study suggests that TDA can be used to potentially expose early warning signals for impending market crashes," wrote the researchers in their conclusion. Market crashes can be associated with the weakening of persistence and clustering of point clouds in the TDA.
"With tools such as persistent homology in hand, researchers and econometricians can easily identify which industries can be greatly affected during hard times like the COVID-19 pandemic. This, in turn, can aid investors, decision-makers, and policymakers in minimizing risks and crafting policies to prioritize giving help to industries that suffered significant economic loss," they added.
Despite the promising results, the researchers acknowledge the limitations of their study. The analysis was confined to three companies over a brief period, and different markets or time frames might yield varied outcomes. They suggest that further research could extend the TDA approach to other types of time series data, such as exchange rates, to explore its effectiveness in detecting structural changes and understanding the behavior of financial indicators under diverse economic conditions.
Source:
Riñon E.M, and Sambayan R. (June 2024). Topological Approach for Detection of Structural Breakpoints in Philippine Stock Price Data Surrounding the COVID-19 Pandemic. Philippine Journal of Science, 153(3): 1177–1188.