
Financial Adviser: 5 Worst Performing Blue-Chip Stocks in the First 6 Months of 2025 and How to Profit from Them

As we pass the mid-year mark, the stock market faces significant challenges. Persistent market uncertainties, driven by the looming threat of a global recession and ongoing conflicts in the Middle East, have dampened investor sentiment. These factors have contributed to the declining and volatile state of the stock market.
Despite encouraging signs of decreasing inflation and interest rates, investors remain cautious, prompting them to keep their funds outside the stock market. The recent downturn in global stock markets, including significant losses last weekend and yesterday, reflects heightened investor anxiety over these geopolitical tensions and economic uncertainties.
The PSE Index has already lost more than 200 points from its high at the start of the year. Although the recent rally may have offered some hope of reversal, the rebound could be short-lived given the prevailing pessimism in the market. A failure to break above the 6,600 resistance could send the PSE Index back to critical support of 6,200.
While many stocks currently appear undervalued, there is no guarantee of a sustainable recovery. In fact, share prices may continue to decline amidst prevailing market pessimism. The market's Price-to-Earnings (PE) ratio stands at a historically low 10.3 times, but given the uncertainties and sentiment, pricing multiples may fall further.
By calculating the current opportunity cost and adding a standard risk premium, we estimate the fair value of the PSE Index at a PE ratio of 8.9 times, suggesting a potential 13.5 percent decline to 5,581.
It may take some time before the market finally recovers. In the meantime, investors should be aware of potential value stocks in the market. The philosophy of contrarian investing teaches that the rewards of standing apart from the crowd and investing intelligently, even when it is not popular or rewarded in the short-term, can be substantial over the long term. Investing during a market downtrend may offer opportunities for significant potential returns in the long run.
For the first six months of 2025, we take a look at the five biggest blue-chip losers to date and where investors can potentially pick them up. Stocks that have tumbled the most often have the highest potential of providing substantial returns upon recovery, although not all badly beaten stocks will recover first.
In summary, while the market remains bearish, opportunities still exist for those who are willing to look beyond the current pessimism and invest strategically.
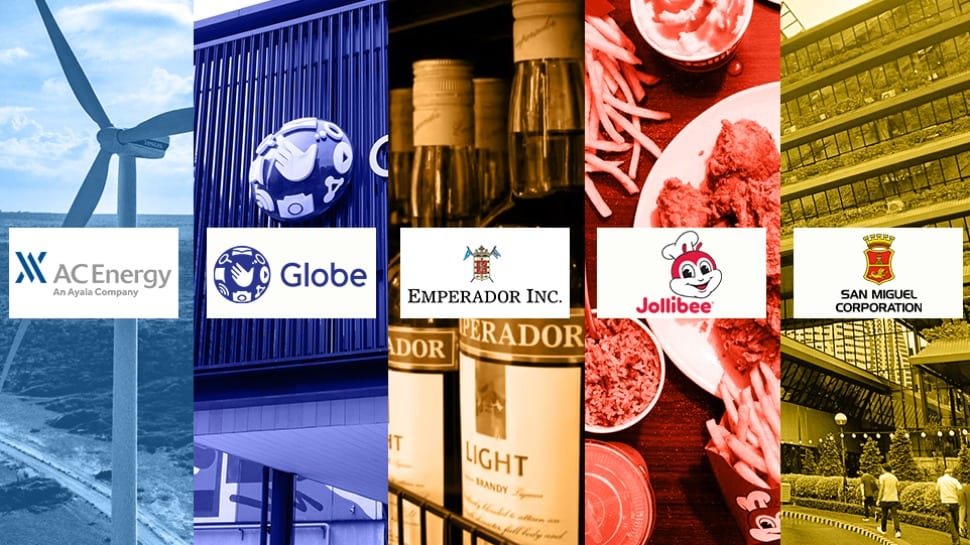
Here are the five worst-performing blue-chip stocks in the PSE and how to profit from them:
ALSO READ
Financial Adviser: 5 Ways to Pick Winning Stocks During a Bear Market—and How to Profit From It
1| ACEN Corporation
Price: P2.62
Year-to-date loss: -34.5 percent
AC Energy (PSE: ACEN) is one of the largest listed renewable energy companies in Southeast Asia with a total net attributable capacity of 4,000 MW. About 40 percent of its total capacity is contributed by its operations in the Philippines while the balance of 60 percent is shared by Vietnam, Indonesia, India, and Australia.
ACEN, which sources its renewable energy mainly from solar and wind power, currently operates about 68 percent of its total capacity, while 32 percent is still under construction.
Last year, ACEN’s total revenues rose slightly by 2.2 percent from P36.5 billion to P37.3 billion. While electricity sales remained flat, higher other revenues and the return of dividend income helped lift overall growth.
More significantly, the company saw a 13.8 percent drop in total cost of sales, driven by lower power purchase and fuel expenses. This led to gross profit more than doubling and gross margin improving from 13.1 percent to 26.7 percent, which signaled stronger operational efficiency.
ACEN also managed its expenses well, cutting overall general and administrative costs by 6.5 percent despite increases in personnel and other administrative spending. The key driver was a sharp reduction in impairment provisions. These cost improvements helped boost profitability, with income before tax rising 16.6 percent and net income increasing by 11 percent, which reached to P10.1 billion in 2024
However, for the first quarter of 2025, ACEN’s total revenues fell by 21.2 percent to P7.77 billion from P9.85 billion in the same period last year. The sharp decline was mainly due to a 22.7 percent drop in electricity sales, which likely reflected lower demand, pricing, or operational issues. While rental and other revenues slightly increased and dividend income returned at P115 million, these gains were not enough to offset the overall revenue decline.
On the cost side, electricity-related expenses fell 14.9 percent, driven by a P1.74 billion drop in purchased power costs. However, general and administrative expenses rose by 21 percent, mainly due to a P210 million increase in impairment provisions. Depreciation and other costs also climbed, though personnel expenses remained stable. These pressures resulted in a 32.3 percent drop in income before tax, while net income declined by a smaller 29 percent, ending at P2.08 billion due to a higher tax benefit.
ACEN’s stock price has been on a steady decline since August 2024, losing 56.3 percent of its value—from a high of P6.00 to its current price of P2.62 per share. At this price, ACEN is currently trading at a 12-month trailing PE ration of 12x, which is slightly high compared to the power industry average in emerging markets which has PE ratios of typically 10x.
If we price ACEN on Enterprise Value to EBITDA (EV/EBITDA) ratio, we can simply add ACEN’s market capitalization of P103.95 billion with its total debt, which includes short-term loans, long-term loans, notes payable, and lease liabilities—amounting to approximately P151.18 billion. After subtracting cash and cash equivalents of P22.55 billion, we arrived at an EV of P232.58 billion.
Using estimated EBITDA of P11.59 billion, we can estimate ACEN’s EV/EBITDA to be at 20.1x. An EV/EBITDA multiple of 20.1x is considered high when compared to typical power sector peers, who generally trade between 7x to 12x, especially in the Philippine and ASEAN energy markets.
Even for renewables—which tend to command higher multiples due to long-term growth potential—this valuation suggests a market premium is being placed on ACEN’s future pipeline, regional expansion, or strategic partnerships.
ACEN’s current EV/EBITDA of 20.1x indicates the stock may be fully valued—or even overvalued—relative to its present financial performance.
ACEN’s share price could continue to decline and test a major support level near P2.50 per share, which served as the breakout point back in 2020. If the stock holds above P2.50, it could mark the start of a new impulsive wave. However, if this support fails to hold, the price may fall further toward P2.00 or lower, which will complete a full retracement of the previous uptrend.
2| Globe Telecoms
Price: P1,666
Year-to-date loss: -23.7 percent
Globe Telecoms (PSE: GLO) is the leading telecommunications and technology provider in the country with 60.9 million mobile subscribers, 1.74 million home broadband customers, and over 700 thousand landline subscribers.
About 71 percent of GLO’s revenues comes from mobile service, 14.5 percent from home broadband, and another 14.5 percent from corporate data, fixed line voice, and non-service revenues.
Last year, GLO’s total revenues grew marginally by just 0.2 percent to P180.59 billion from P180.16 billion in 2023, mainly due to a 12.7 percent decline in non-service revenues. This was partially offset by a modest 1.7 percent increase in service revenues.
However, on the cost side, GLO’s total expenses inched up to P160.49 billion from P159.23 billion, with lower general and administrative expenses offset by higher depreciation and financing costs, which rose by 6.6 percent and 18.9 percent respectively.
Despite stable cost control, income before tax declined by 6.4 percent, reflecting the pressure from flat revenue growth and rising capital-related expenses. As a result, net income held steady at P24.29 billion, nearly unchanged from the previous year, but remained well below 2022 levels due to the absence of extraordinary gains like the P10.5 billion data center sale recorded two years earlier.
This year, for the first quarter of 2025, GLO’s revenues declined by 3.4 percent to P43.76 billion from P45.31 billion a year earlier, mainly due to a drop in both service and non-service revenues while total expenses rose slightly by 2.1 percent to P40.54 billion, driven by higher depreciation and financing costs.
Despite softer revenues and rising capital-related expenses, GLO’s net income grew 2.6 percent to P6.98 billion, supported by strong other income and higher earnings from joint ventures. Although income before tax declined, a lower tax provision helped offset the impact.
Similar to ACEN, GLO’s share price has been on a steady decline since October last year, falling from a peak of P2,400 to P1,666 today—losing 30.5 percent of its value.
At its current share price, GLO is currently trading at a PE of about 10x to 11x, which is below its historical and peer averages. Combined with reasonable Price-to-Sales ratio of 1.3 times and Price-to-Book of 1.4 times multiples, the stock appears relatively undervalued, particularly against the telecom sector, which often trades at higher multiples driven by growth and stability.
However, the valuation reflects tempered investor sentiment. This is possibly due to slowing core revenue growth, pressure on margins, cyclicality in tower disposal gains and ongoing capital expenditure and debt funding.
Nevertheless, GLO’s current valuation presents a value opportunity, especially if the company can stabilize revenues, manage interest/balance sheet pressures, and return to mid-cycle profitability.
A forward PE around 11x combined with a healthy six percent dividend yield frames GLO as a solid income play with potential upside as market tailwinds improve.
3| Emperador, Inc
Price: P15.10
Year-to-date loss: -16.3 percent
Emperador Inc. (PSE: EMI) is the world’s largest brandy producer and the Philippines’ leading liquor company, with a global footprint spanning 116 countries.
As a holding company with operations in the Philippines, Spain, the United Kingdom, and Mexico, Emperador manufactures, bottles, and distributes a wide range of distilled spirits—from accessible to luxury brands.
Its flagship product, Emperador Brandy, dominates the Philippine market, while its portfolio also includes some of the oldest and most iconic Scotch whisky brands, making it the fifth largest Scotch whisky producer globally.
Through strategic acquisitions of century-old heritage brands in Spain and Scotland, Emperador has grown from a local brand into a major global player in the alcoholic beverage industry.
Last year, EMI’s total revenues and other income declined by 6.1 percent to P61.65 billion from P65.64 billion in 2023, reversing the modest growth seen the previous year. The drop suggests weaker market demand or pricing pressure, particularly across international operations.
While cost of goods sold also fell by 3.2 percent, which reflected lower production or input costs, selling and distribution expenses rose by 5.8 percent, possibly due to expanded marketing or increased logistics costs.
General and administrative expenses were trimmed by 10.7 percent, indicating some success in cost control. However, rising interest expenses, which jumped by 24.6 percent year-on-year, signaled growing financing burdens as borrowing costs continue to climb.
As a result, profit before tax fell sharply by 25.8 percent, from P10.94 billion to P8.12 billion. Even with a lower tax provision, net profit dropped by 27.5 percent to P6.49 billion, continuing the downward trend from P10.21 billion in 2022 and P8.94 billion in 2023. This marks the second consecutive year of earnings decline, which underscored pressure on margins despite tighter expense management.
For the first quarter of 2025, EMI’s total revenues and other income slightly increased to P13.21 billion, up from P13.12 billion in the same period last year. This marginal growth was supported by a 1.7 percent decrease in cost of goods sold.
However, overall costs and expenses rose slightly to P11.13 billion from P10.99 billion, driven primarily by a 24 percent increase in selling and distribution expenses, which resulted from higher marketing and logistics costs.
As a result, profit before tax remained relatively flat, decreasing slightly from P2.13 billion to P2.08 billion. A key driver of improved bottom-line performance was the sharp drop in tax expense, which fell by 41.8 percent, which brought down the effective tax burden. This led to a six percent increase in net profit, which rose from P1.76 billion in 2024 to P1.86 billion in 2025.
EMI’s share price has been relatively stable at P18 per share throughout most of 2024, until early this year when it sharply declined to P11.26, possibly due to weaker earnings performance or declining global demand for brandy and Scotch whisky. Since then, the stock has rebounded by 34 percent to P15.10 per share.
At its current share price, EMI is currently trading at a high trailing PE of 36.7x, which is significantly above typical beverage and spirits industry multiples of around 10–20x.
EMI’s Price-to-Growth ratio of 6.15 implies that earnings growth isn’t fully reflecting the high valuation, which raises questions about the sustainability of current share prices unless earnings accelerate further.
The recent rally in EMI’s stock price from P11 to P15 may signal a potential trend reversal. However, a break above the P17 to P18 resistance level is needed to confirm a sustained uptrend. Failure to break this key level could lead to a deeper correction, with the stock potentially falling back to P11—or even lower to P9 per share.
EMI’s PE of 36.7 implies that the market is pricing in strong future growth or viewing Emperador as a premium global brand. But with slowing global demand for brandy and whisky, there is a real risk that any earnings miss or macro slowdown could trigger a sell-off.
4| Jollibee Foods Corporation
Price: P227
Year-to-date loss: -15.6 percent
Jollibee Foods Corporation (PSE: JFC) is the largest and most dominant quick-service restaurant (QSR) company in the Philippines, and one of the biggest Asian food service chains in the world.
With over 1,279 Jollibee stores nationwide and 480 more across international markets, including the U.S., Canada, the U.K., Middle East, and Southeast Asia, JFC operates a powerhouse portfolio of beloved brands such as Jollibee, Chowking, Greenwich, Red Ribbon, Mang Inasal, Highlands Coffee, Smashburger, The Coffee Bean & Tea Leaf, and Tim Ho Wan, among others.
Known for its strong franchise model and massive customer base, JFC boasts a global network of over 6,800 stores across 34 countries.
Last year, JFC’s total revenues rose by 10.6 percent to P269.94 billion, up from P244.11 billion in 2023 and P211.90 billion in 2022. This consistent growth was driven by strong performance in gross sales, which increased by 9.7 percent, and in royalty and setup fees, which rose by 21 percent year-on-year.
However, operating expenses increased by 12.8 percent, with general and administrative expenses amounting to P29.75 billion, up from P26.08 billion in 2023.
Despite the rise in costs, JFC’s income before tax grew by 15 percent to P14.19 billion from P12.34 billion in 2023. After tax, net income jumped by 20.1 percent, rising from P8.99 billion in 2023 to P10.80 billion in 2024.
This year, for the first quarter of 2025, JFC’s total revenues rose by 14.6 percent, from P61.30 billion in Q1 2024 to P70.23 billion in Q1 2025. This was driven by a 13.8 percent increase in gross sales and a 26.1 percent rise in royalties, setup fees, and other income, highlighting a stronger system-wide performance and franchise growth.
However, operating expenses rose by 15.6 percent, largely driven by a 56.2 percent increase in advertising and promotions—indicating aggressive brand marketing. General and administrative expenses also grew 11.4 percent.
While operating income improved, these rising costs were not enough to offset other pressures on profitability. As a result, net income declined by 7.6 percent to P2.50 billion, primarily due to a 50.5 percent increase in interest expense, a 41.5 percent jump in current income tax, which outpaced pre-tax profit growth, and a 31.4 percent drop in other income.
JFC’s stock price has been declining since October last year, falling from a high of P279 per share to P227, representing an 18.6 percent loss in value. At its current share price, JFC’s current PE ratio of 26.4x reflects a significant premium over global QSR peers, which typically trade between 15 and 25 times earnings. This suggests that investors are pricing in strong expectations for JFC’s international expansion.
While the high PE suggests future earnings could validate its valuation over time, investors should watch closely for execution risk. If earnings growth misses targets or macro headwinds such as inflation, rising labor costs, Forex volatility intensify, valuation multiples may contract back toward the 15–20x range. If this happens, JFC’s stock price could fall back toward the P200 level, and possibly even lower to P180 per share.
5| San Miguel Corporation
Price: P77
Year-to-date loss: -10.4 percent
San Miguel Corporation (PSE: SMC) is one of the Philippines' largest and most diversified conglomerates, with revenues equivalent to approximately four percent of the country’s GDP.
SMC holds market-leading businesses and strategic investments across a wide range of sectors, including beverages, food, packaging, energy, fuel and oil, infrastructure, cement, property development and leasing, car distribution, and banking services.
As of the latest breakdown, around 53.5 percent of SMC’s total revenues come from its fuel and oil business, 27 percent from food and beverages, and 12.4 percent from infrastructure, with the remainder contributed by packaging, cement, real estate, and other business segments.
Last year, SMC’s sales rose by 8.9 percent to P1.58 trillion from P1.45 trillion in 2023, which reflects solid topline growth. However, cost of sales also increased by 8.6 percent, which kept gross profit growth modest at 10.5 percent, rising from P238.3 billion to P263.4 billion.
Despite higher revenues, operating expenses and financing costs also climbed: selling and administrative expenses grew by 9.3 percent to P102.5 billion, while interest expense and other financing charges rose by another 8.9 percent to P99.4 billion.
As a result, SMC’s income before tax dropped by 12.2 percent, from P73.1 billion to P64.2 billion. After tax, net income declined 18.0 percent to P36.7 billion in 2024, down from P44.7 billion in the prior year, indicating pressure from rising costs, higher taxes, and adverse other income charges despite revenue growth.
For the first quarter of 2025, SMC’s sales declined 8.1 percent, down to P360.91 billion from P392.71 billion in 2024. Despite the drop in topline, cost of sales fell even faster, by 11.3 percent, which improved gross profit by 8.2 percent to P69.60 billion. With operating expenses remained flat at P23.99 billion, operating income went up by 12.7 percent to P45.6 billion from the previous year’s P40.4 billion.
The strongest driver of SMC’s net income came from the sharp reversal in other income, which swung from a P6.85 billion loss in 2024 to a P25.34 billion gain in 2025. This was primarily due to a major transaction involving the sale of 67 percent equity interests in key gas-fired power assets and LNG infrastructure.
Because of this, after accounting for a higher tax expense of P9.43 billion, net income jumped to P43.38 billion, nearly five times more than the P8.89 billion reported in 2024.
At its current price, SMC is trading at PE Ratio of 14.5x. This is moderate by global standards and implies that while earnings exist, the market is not pricing in significant growth. This may reflect SMC’s capital-heavy structure and earnings volatility from cyclical industries such as fuel, infra and cement.
SMC’s extremely low Price-to-Sales ratio of 0.14x suggests that the market values SMC’s entire business is only 14 percent of its annual sales. Such a low multiple is rare for a conglomerate and implies deep discounting or structural skepticism.
SMC also have very low Market Cap to Total Liabilities (MV/TL) ratio of 0.14, which indicates that the market only values the entire SMC business at 14 percent of its liabilities. In other words, if the market is correct, equity is a thin cushion, and debt holders bear most of the balance sheet risk.
SMC’s stock price is currently testing its critical long term support at P75. If it holds, a reversal may begin, but if this breaks decisively, the stock could go down further to P60 or even P50.
Henry Ong, RFP, is an entrepreneur, financial planning advocate and business advisor. Email Henry for business advice hong@financialadviser.ph or follow him on Twitter @henryong888